Visual field testing in early glaucoma

C. Gustavo De Moraes
Edward S. Harkness Eye Institute
Columbia University
Medical Center
There is a growing body of evidence that early glaucomatous damage involves the macula. The macula is often defined, but not always, as the retinal region within ± 8 degrees from the foveal center, although other authors employ other definitions. This area corresponds to about 2% of the retinal area, contains approximately 30% of the retinal ganglion cells (RGCs), and is represented by over 50% of primary visual cortex.1,2 Loss of the macula and thus central vision significantly affects patients’ health-related quality of life (HRQoL).3-5 There is compelling evidence that glaucoma affects the macula and that macula damage can occur early in the disease process.6
24-2 SAP misses 16% of central field defects detected with 10-2 SAP and/or OCT
However, glaucomatous damage to the macula is often missed in clinical practice. Some of the reasons are: 1. traditional glaucoma knowledge supports that glaucoma is fundamentally a peripheral disease; 2. inherent limitations of conventional clinical tests to detect damage to the macula; and 3. the paucity of large, prospective studies that describe the nature of glaucomatous damage to the macula. We have shown that macular damage is prevalent among patients with early glaucoma if one employs the appropriate tools to assess it, namely 10-2 standard automated perimetry (SAP) and high-resolution optical coherence tomography (OCT). This information comes from a prospective database in which all patients with or suspected glaucoma have undergone 10-2 and 24-2 testing in an unbiased fashion.6
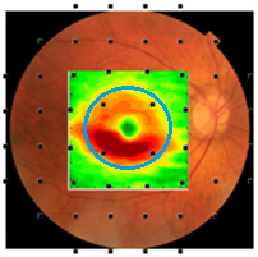
Fig. 1. The average loss of macular retinal ganglion cells + plexiform layer (RGC+) thickness of patients with early glaucomatous damage is shown in pseudo-color (hot colors meaning thicker). The RGC+ is superimposed on a fundus photo and 24-2 SAP grid. The visual field test points are morphed to account for the displacement between photoreceptors and RGCs. Note that only four of 54 locations are testing the macula (± 8°, blue circle) region and these are poorly sampling the region with the most RGC damage.6
There is currently no gold standard to define progressive loss of visual function due to glaucoma, although the 24-2 SAP has been used for that purpose. However, 24-2 SAP misses 16% of central field defects detected with 10-2 SAP and/or OCT.7 The primary reason for the poor performance is it does not sample the part of the central region most vulnerable to glaucoma. This can be seen in Figure 1 where the points of the 24-2 test pattern are superimposed on a pseudo-color map of the average RGC layer thickness loss in the macular region of an eye with early glaucomatous damage.6
Moreover, in some patients structural damage as measured with the fdOCT can be detected earlier than functional damage as measured with SAP.8 Thus, the guidelines of first Consensus Meeting of the World Glaucoma Association stated that an accurate evaluation of glaucoma progression requires a combination of both structural and functional tests.9
Using a retrospective 10-2 longitudinal database,10-12 we described the pattern of progression with this test, as an analogy to the studies using 30-2 fields performed over 20 years ago.13 As shown in Figure 2, eyes with superior hemifield defects have an arcuate pattern approximately 3° to 5° above fixation, which is deeper in eyes with more advanced disease. As severity increases, the scotoma then elongates toward the physiologic blind spot and spreads toward the nasal periphery, sparing the area corresponding to the papillomacular bundle. For inferior hemifield defects, a similar pattern was seen, although it was slightly farther from fixation.14

Fig. 2. Schematic view of the average pattern deviation maps of superior initial parafoveal scotomas of 80 eyes (all flipped to represent right eyes) in a cross-sectional analysis. 10-2 visual field results were divided into subgroups based on the severity of glaucoma using their pattern standard deviation (PSD). Cross-sectional data were used to create an average pattern deviation map that was generated by averaging pattern deviation map values of 10-2 visual field point-by-point within each subgroup (A, B, C, and D). The grayscale is shown on the right. Superior defects are present (A) in the earliest stage as a diffuse arcuate, (B) later in the disease process a deeper defect above the fixation point is seen. (C and D) The defect later appears larger and closer to the physiologic blind spot and the nasal periphery, sparing the area corresponding to the papillomacular bundle.
In another study, Hood et al.14 tested an anatomical model of local glaucomatous damage to the macula with high density perimetric visual field data; the portion of the model associated with the upper visual field (inferior retina) is shown in Figure 3. The model accurately predicted a ‘vulnerable macular region’ and a ‘less vulnerable macular region’. Note that there is a good correspondence between these vulnerability regions and the pattern of visual field damage described in Figure 2.
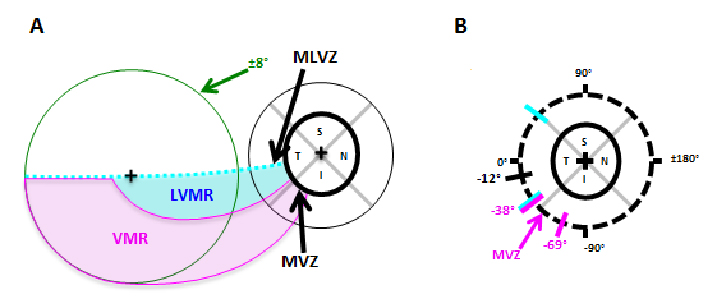
Fig. 3. According to the Hood model, there is a ‘vulnerable macular region’ (VMR, magenta) and a ‘less vulnerable macular region’ (LVMR, cyan). A. The portion of the model associated with the upper visual field (inferior retina) is shown; it contains a LVMR (cyan) and a VMR (magenta). B. The regions of the disc associated with the VMR and LVMR are indicated by the magenta and cyan diagonal lines, respectively.
10-2 tests rates of progression were up to two times faster than the corresponding 24-2 tests performed in the same eyes in the same follow-up period.
Additionally, we investigated whether 10-2 visual field tests detected more progression than the conventional 24-2 testing.12 When comparing rates of progression of the 24-2 visual field index with the 10-2 central field index, 10-2 tests rates of progression were up to two times faster than the corresponding 24-2 tests performed in the same eyes in the same follow-up period. Figure 4 presents data from one such patient whose Humphrey visual field index revealed non-significant rates of progression (-0.2%/yr), whereas the 10-2 revealed catastrophic progression (-3.4%/yr).12 If followed only with the 24-2, most clinicians would assume this eye would not become blind within the patient’s life and would thus not modify treatment. However, a more detailed analysis with 10-2 fields shows this eye would become blind over ten times faster and thus enhanced treatment is advised.
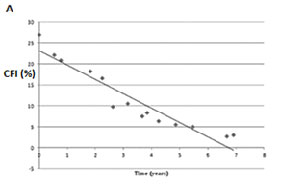
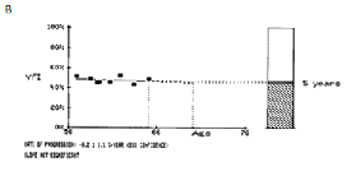
Fig. 4. A. The 10-2 central field index (CFI) of a patient over a seven-year period. B. The 24-2 visual filed index (VFI) from the Glaucoma Progression Analysis printout (GPA, Carl Zeiss Meditec, Inc., Dublin, CA) for the same data. Note that the slope measured with 24-2 fields did not reach statistical significance, although the CFI revealed a slope of -3.4%/yr at P < 0.001.
Additionally, in some patients macular RGC loss measured with OCT can precede macular RNFL loss and may be missed with 24-2 SAP
Additionally, in some patients macular RGC loss measured with OCT can precede macular RNFL loss and may be missed with 24-2 SAP. Figure 5 A and B depicts the macular retinal nerve fiber layer (mRNFL, left) and macular retinal ganglion cells + plexiform layer (mRGC+, right) of a patient followed between 8/2008 and 2/2011. Note that there was a substantial drop-out in mRGC+ thickness in only one year (between 3/2009 [blue line] and 4/2010 [yellow]), which was not seen when measuring mRNFL thickness. Further, the 24-2 SAP tests in the period did not reveal any significant change (Figure 5D), although the 10-2 tests revealed expansion of a superior arcuate defect (Figure 5C).
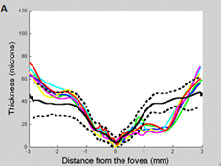
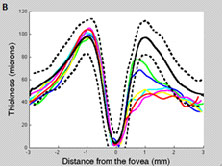
Fig. 5. Left eye of OAG patient followed from 8/2008 (green line) to 5/2011 (red). The dotted and solid lines correspond to the 95% confidence intervals and the mean thickness, respectively, derived from our cross-sectional database. A. Note there was no meaningful change in RNFL thickness (besides long-term variability) during follow-up. B. Note the loss of RGC+ thickness between 03/2009 (blue) and 10/2009 (cyan), after which it remained relatively stable until 04/2010 (yellow) and 11/2010 (maroon). C. The 10-2 was suggestive of progression (no automated analysis software available yet). D. The 24-2 did not reveal any significant change.
In summary, clinicians should be encouraged to perform 10-2 visual field tests in patients with early glaucoma, and not only in severe cases with scotomata close to fixation. In particular, eyes with clinical signs of glaucomatous optic neuropathy with normal 24-2 SAP or those with OCT findings suggestive of macular damage may benefit from 10-2 testing. If damage is then confirmed, these eyes should be followed with a combination of 24-2 and 10-2 tests to monitor progression.
References
- Curcio CA, Allen KA. Topography of ganglion cells in human retina. J Comp Neurol. 1990;300(1):5-25.
- Schira MM, Wade AR, Tyler CW. Two-dimensional mapping of the central and parafoveal visual field to human visual cortex. J Neurophysiol. 2007;97:4284-4295.
- Parrish RK, 2nd. Visual impairment, visual functioning, and quality of life assessments in patients with glaucoma. Transactions of the American Ophthalmological Society. 1996;94:919-1028.
- Gutierrez P, Wilson MR, Johnson C, et al. Influence of glaucomatous visual field loss on health-related quality of life. Arch Ophthalmol. 1997;115(6):777-784.
- McKean-Cowdin R, Varma R, Wu J, Hays RD, Azen SP. Severity of visual field loss and health-related quality of life. Am J Ophthalmol. 2007;143(6):1013-1023.
- Hood DC, Raza AS, de Moraes CG, et al. Glaucomatous damage of the macula. Prog Retin Eye Res. 2013;32:1-21.
- Traynis I, De Moraes CG, Raza AS, Liebmann JM, Ritch R, Hood DC. Prevalence and nature of early glaucomatous defects in the central 10° of the visual field. JAMA Ophthalmol. 2014;132(3):291-297.
- Lisboa R, Paranhos A Jr, Weinreb RN, Zangwill LM, Leite MT, Medeiros FA. Comparison of different spectral domain OCT scanning protocols for diagnosing preperimetric glaucoma. Invest Ophthalmol Vis Sci. 2013;54(5):3417-3425.
- Weinreb RN, Greve EL. Association of International Glaucoma Societies. Glaucoma diagnosis: structure and function. Amsterdam: Kugler Publications, 2004.
- Su D, Park SC, Simonson JL, Liebmann JM, Ritch R. Progression pattern of initial parafoveal scotomas in glaucoma. Ophthalmology. 2013;120(3):520-527.
- De Moraes CG, Song C, Liebmann JM, Simonson JL, Furlanetto RL, Ritch R. Defining 10-2 visual field progression criteria: exploratory and confirmatory factor analysis using pointwise linear regression. Ophthalmology. 2014;121(3):741-749.
- De Moraes CG, Furlanetto RL, Ritch R, Liebmann JM. A New Index to Monitor Central Visual Field Progression in Glaucoma. Ophthalmology. 2014;121(8):1531-1538.
- Heijl A, Lindgren G, Olsson J. Normal variability of static perimetric threshold values across the central visual field. Arch Ophthalmol 1987;105:1544-1549.
- Hood DC, De Moraes CG, Ritch R, et al. Test of a Model of Glaucomatous Damage of the Macula with High-Density Perimetry: Implications for the Locations of Visual Field Test Points. Transl Vis Sci Technol. 2014;3(3):5.


